Data Analysis On HIV/AIDS


Table of contents
Team Task: HIV/AIDS Disease Insight Analysis with Power BI.
Contents
Background
Dashboard
Insight Report
Reference
Team members
Team Members:
S/N NAMES
- Odunigba Oluseyi
- Ifeyinwa Nwabueze
- Adedeji Feyisayo Adefunke
- Famurewa Marvellous Erioluwa
- James Ayọ̀Olúwa ALEWU
- Oluwatosin Osisami
- Ajayi Oluwadamilola Fiyin
- Prince Orji
- Ogunbanwo Seyitan.
- Obi Christabel
Background
HIV, the virus that causes AIDS, is one of the world's most serious public health challenges but the world is committed to curbing new infections while ensuring that everyone with HIV has access to HIV treatment. (Global HIV/AIDS Overview, n.d.).To contribute to the global commitment this work will give insight to what is the status of HIV AIDS across the world, where each country stands, it is getting any better. This report aims to create a disease and infection monitoring dashboard to show infected Demographic by Sex, infected Demographic by age range, Reported cases by date, Affected locations heatmap, mortality by region sex, age range, rate, and Total death. The data set (HIV AIDS Dataset, 2020) should be helpful in exploring much more about the above-mentioned factors.
The dataset contains record between 1990 - 2020 with African countries in view.
The main data set was extracted from Kaggle and transformed using Excel and Power BI. The sample data set is shown below.
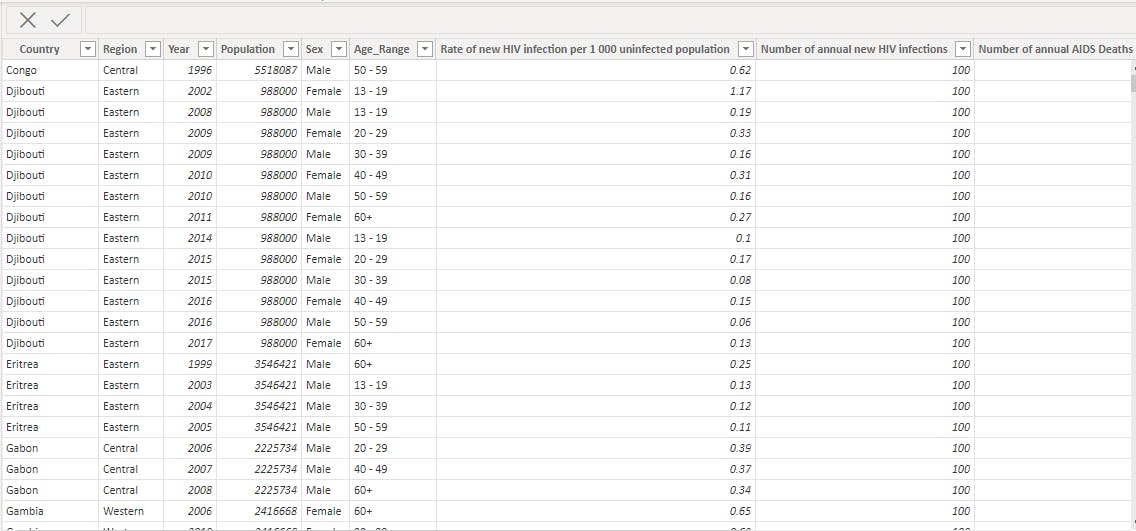
Source: HIV AIDS Dataset. (2020, June 11). Kaggle.
The data was extracted from Excel and transformed using Power Query. A data model was created which showed the relationships between the Fact and dimensions keys with tables as shown below.
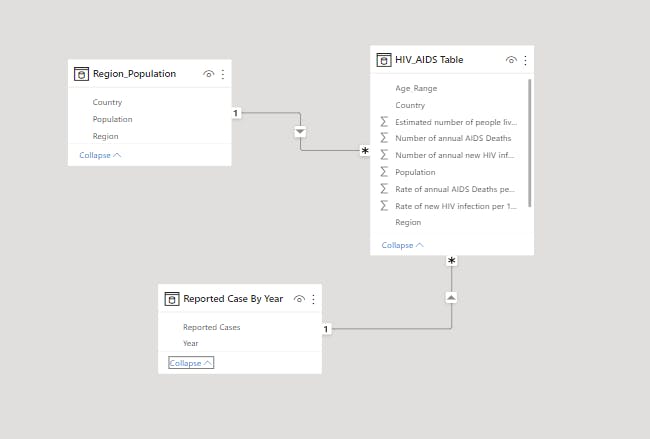
Key metrics were analyzed using charts to gain insight and create reports.
Dashboard The reports are based mostly on reviewing death by sex, age, and population with aggregations by country and region. By tracking these metrics, we were able to create the following dashboards.
Figure 1: Dashboard 1
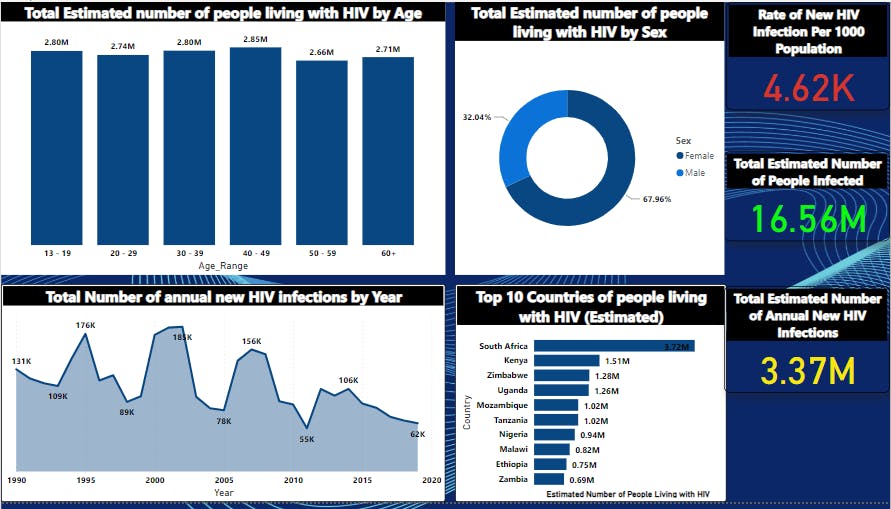
Figure 2: Dashboard 2
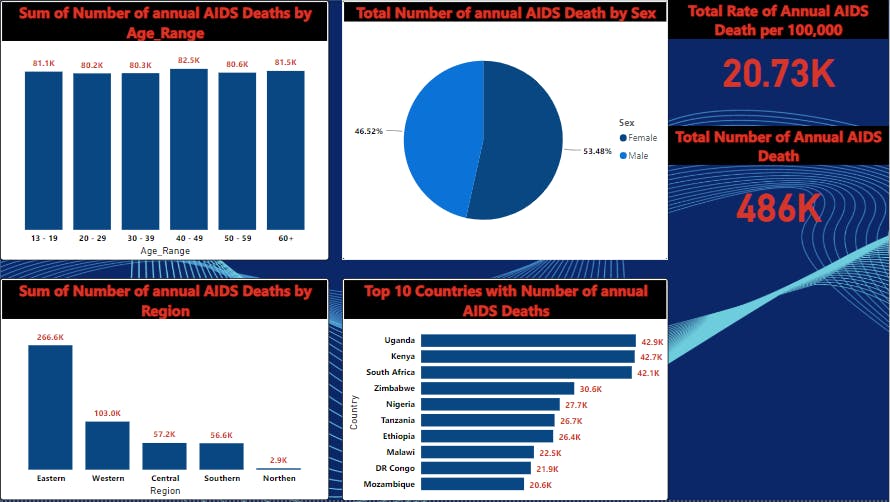
Figure 3: Dashboard 3
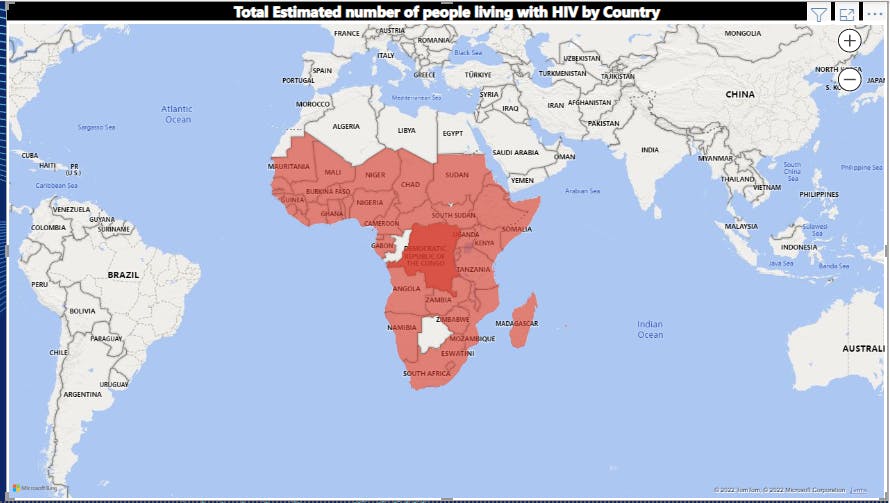
Insight Report Figure 1: Total Estimated number of people infected with HIV is about 16.56M while the estimated annual new HIV infection is about 3.37M. 40-49years age range seems to have the highest infection while 50-59years seems to have lower infection. Gender wise, it appears that more females are living with HIV than male. Country wise, we can see the top 10 countries with the highest infection, South Africa took the lead. Over the years, the rate of spread and the number of new reported cases had declined considerably.
Figure 2: Total annual death is estimated at 486,000people from 1990 to 2020. Gender wise, the female gender has higher percentage of AIDS death than male while Eastern Africa has the highest number of death related to AIDS while Uganda has the highest death related to AIDS in Africa based on the dataset used. It also appears that age 40-49years recorded highest mortality rate while mortality rate is lowest between age 20-29years.
Note: It should be noted that the above insight might not represent the true picture of the real life situation since the dataset cannot be proven authentic.
Reference
HIV AIDS Dataset. (2020, June 11). Kaggle. Retrieved 22 October 2022, from kaggle.com/datasets/imdevskp/hiv-aids-datas..