Covid 19 Analysis Using Power Bi


Team task Work on a health/Disease Insight Analysis. You are to scrap, clean, and visualize data using Power BI and create a disease and infection Monitoring Dashboard
S/N NAMES
- Odunigba Oluseyi
- Ifeyinwa Nwabueze
- Adedeji Feyisayo Adefunke
- Famurewa Marvellous Erioluwa
- James Ayọ̀Olúwa ALEWU
- Oluwatosin Osisami
- Ajayi Oluwadamilola Fiyin
- Prince Orji
INTRODUCTION
COVID-19 is a respiratory viral disease, the virus is transmitted through direct contact with respiratory droplets of an infected person and touching surfaces contaminated with the virus. The purpose of this analysis is to show the infection rate and mortality rate of the disease.
DATA Getting data for this project was a nigh herculean task but it was eventually successful, we were supposed to deliver this project in a 6 days and the first four days was challenging. We finally got a suitable dataset from Kaggle.
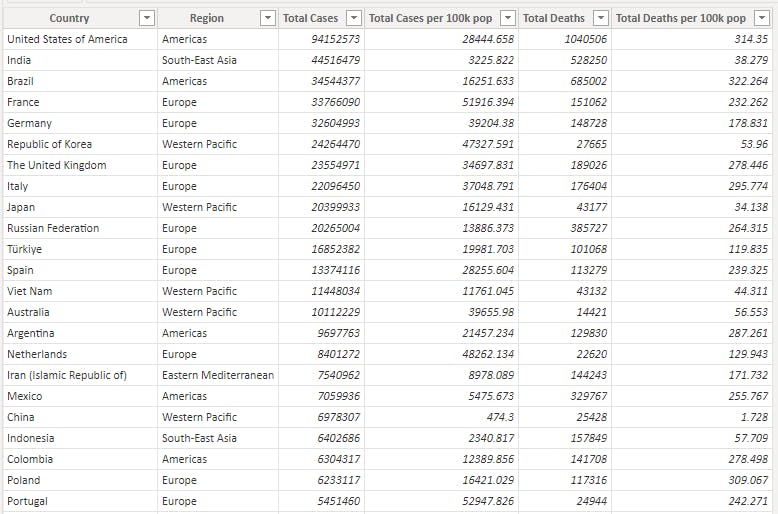
Picture of the dataset The dataset was cleaned using excel, calculation was done to get the total number of confirmed cases per month and also the total number of deaths cases, and the columns that are not needed were removed. Then the data was extracted from excel into Power Bi and transformed using Power query.
REPORTS After the dataset has been transformed, various reports were derived.
Figure 1.
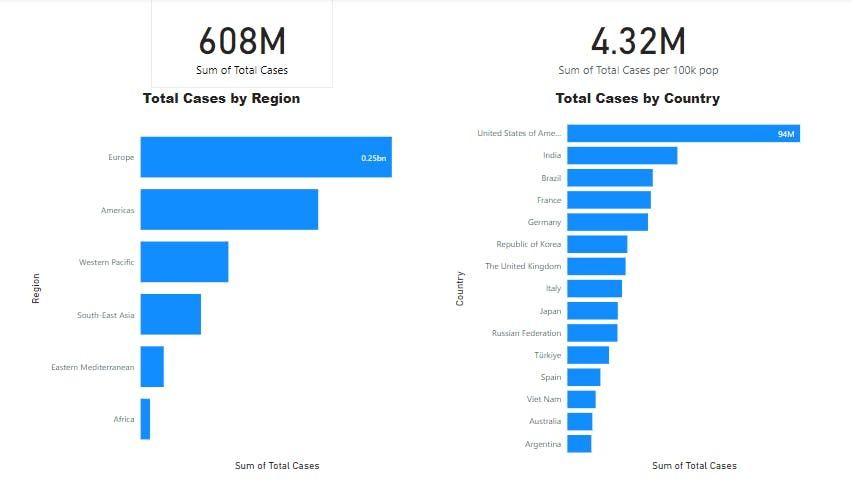
Figure 2.
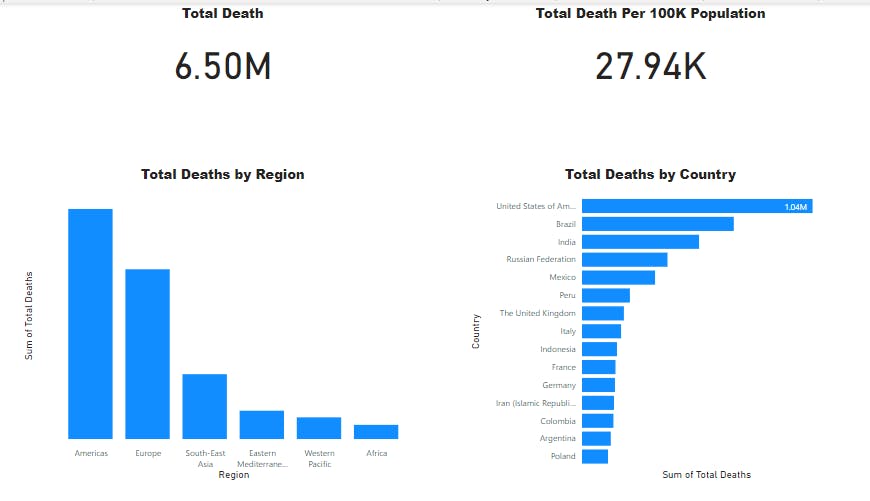
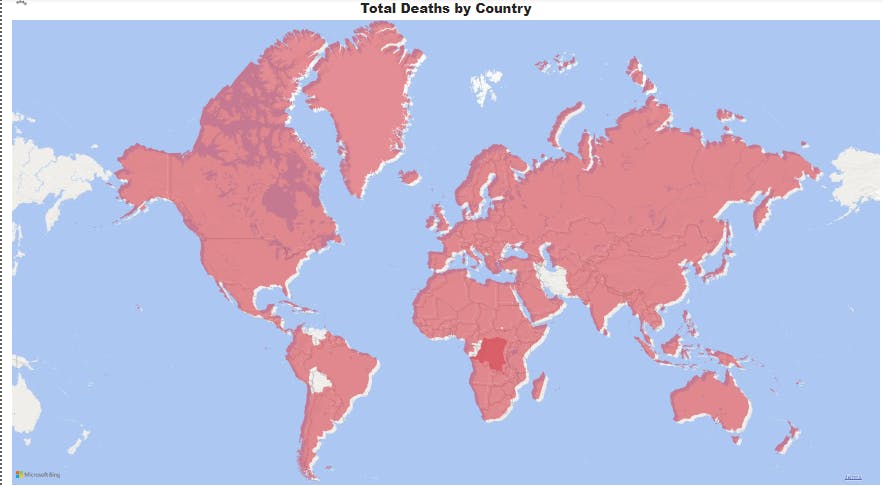
Figure 3.
INSIGHTS From the above figures:
- Figure 1: Europe has the highest number in regards to total Covid cases while Africa has the lowest. The United States of America has the highest total Covid cases amongst all the countries.
- Figure 2: Region wise, Americans has the highest death rate in all region while Africa has the lowest. United States of America recorded the highest death rate according to the dataset presented.
Note: It should be noted that the above insight might not represent the true picture of the real life situation since the dataset cannot be proven authentic.