

Team Task: Choose a product and work on a product sales insight analysis, scrap data, clean, and visualize with Excel and Power BI.
Contents
Background
Excel
Power BI
Insights
Background Data insight is one of the biggest assets of a company, and it is vital for an organization to understand the data they hold. The purpose of this report is to present to the stakeholders, sales insights and corresponding dashboards for data-driven business decisions. This can aid ∙ Expand the business expansion into new regions. ∙ Smart budget and sales forecasting. ∙ Support the company’s strategic goals by allowing senior leaders to track metrics corresponding to these goals through dashboards created using Excel and Power BI. We obtained a dataset from GitHub. This is a two-year Coffee Data Set with tables value as shown below.
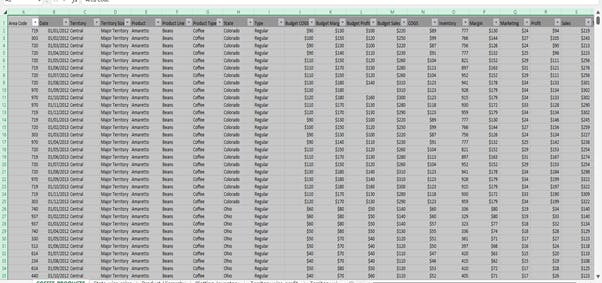
Excel The data set was cleaned and transformed into a pivot table. After analysis, this is what we got.
Using Power BI: The data was extracted from Excel and transformed using Power Query. A data model was created which showed the relationships between the Fact and dimensions keys with tables as shown below.
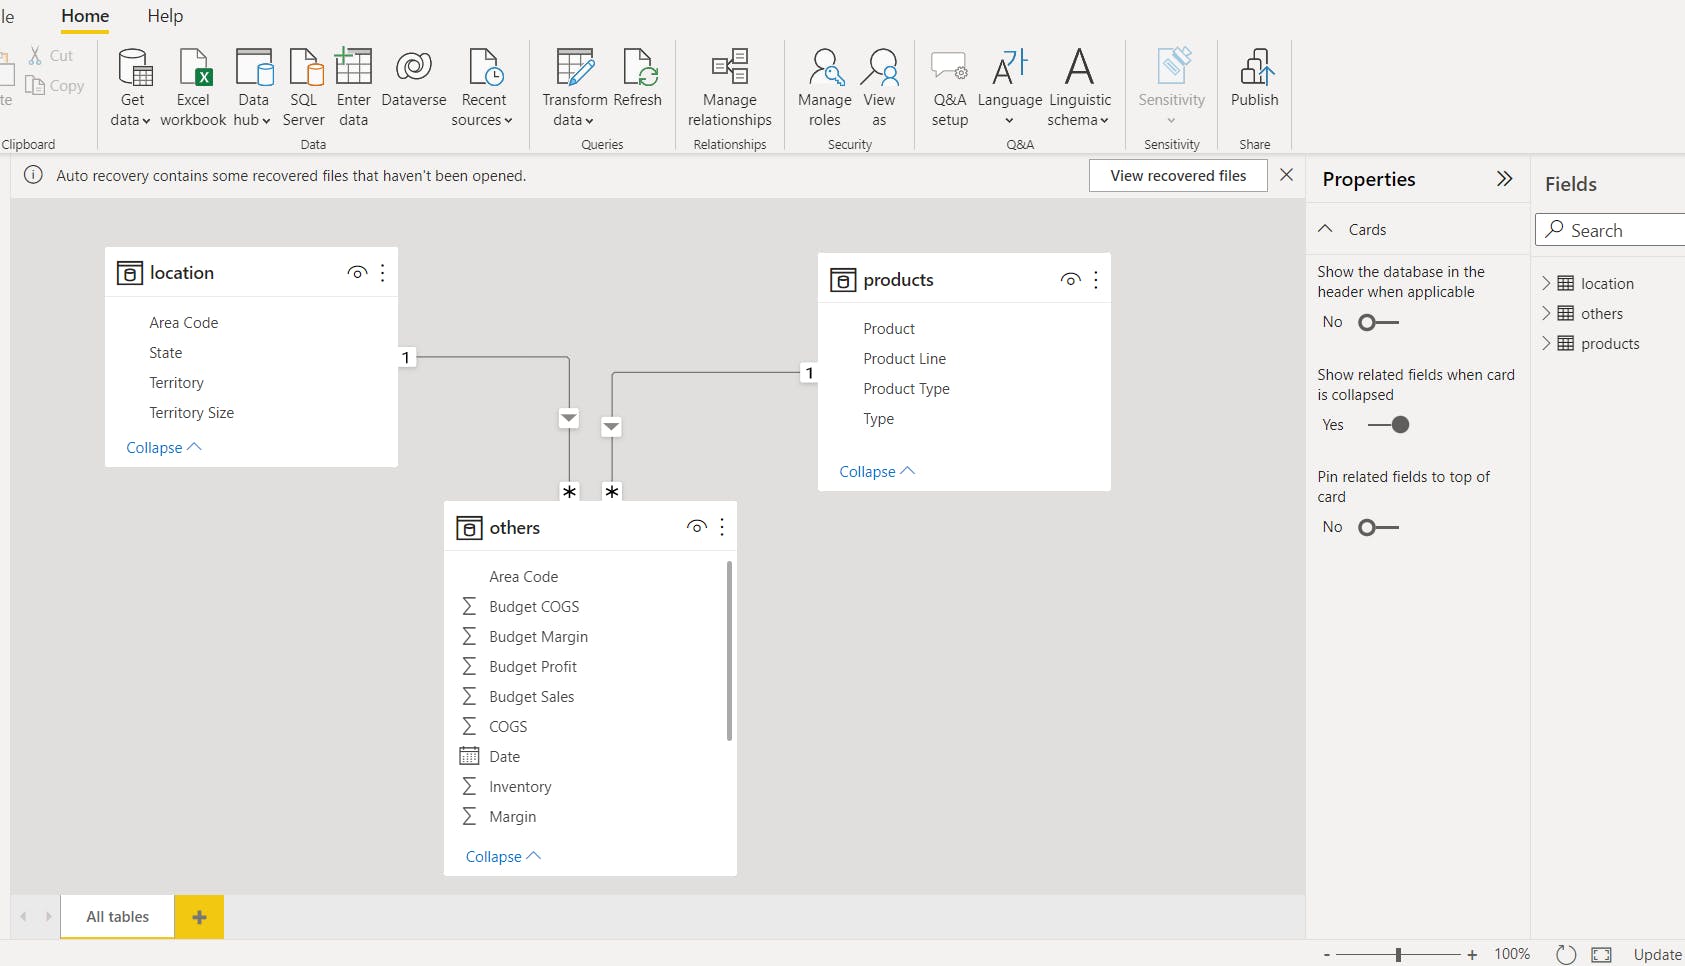
Key metrics were analyzed using charts to gain insight and create reports and finally, a dashboard was built.
Dashboard Design. The reports are based mostly on reviewing sales and profit, and performance around forecasted Sales and production Cost budget. with aggregations by region, product type, and year. By tracking these metrics, we were able to: ∙ Determine whether the coffee products are meeting company-set revenue and profit targets.
Figure 1: Dashboard 1
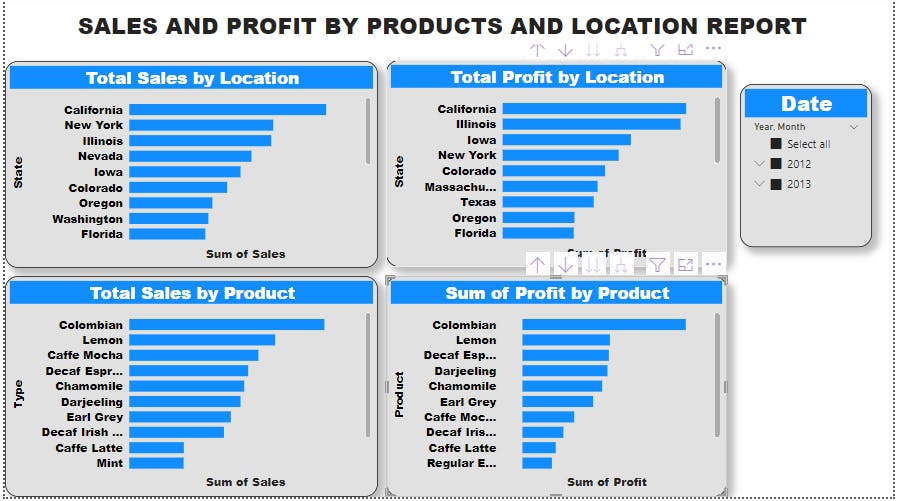
Figure 2: Dashboard 2
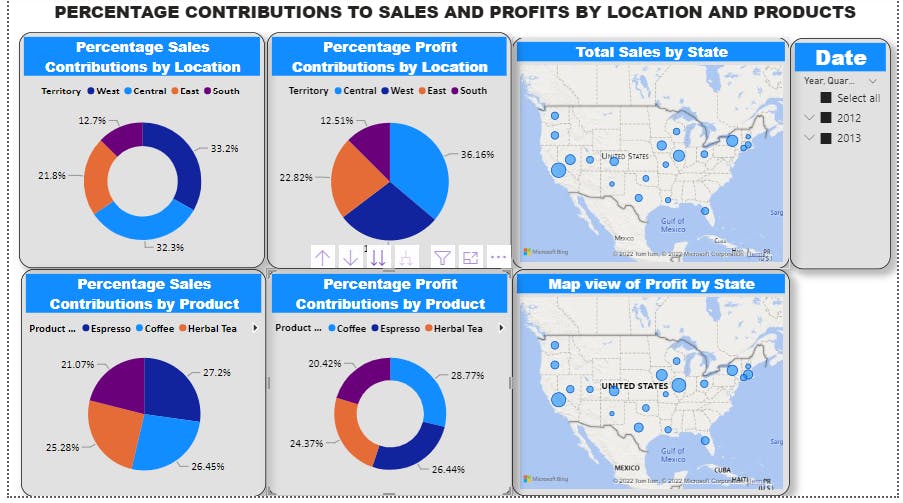
Figure 3: Dashboard 3
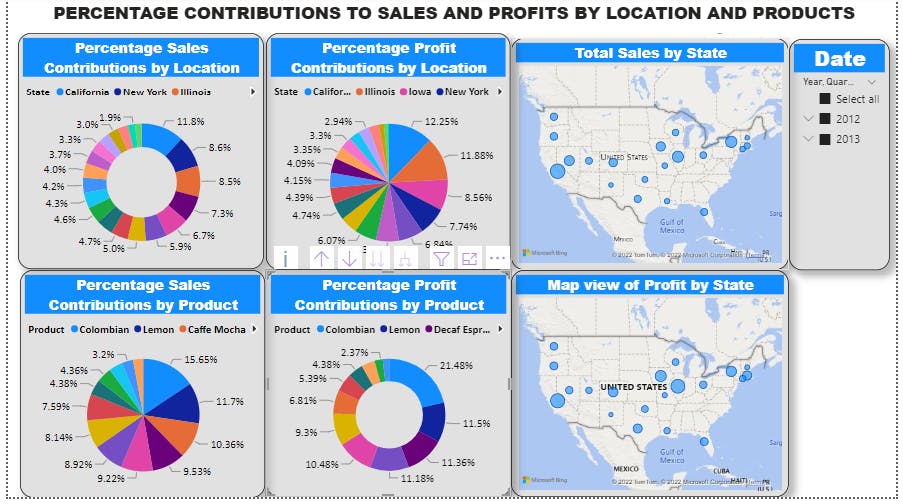
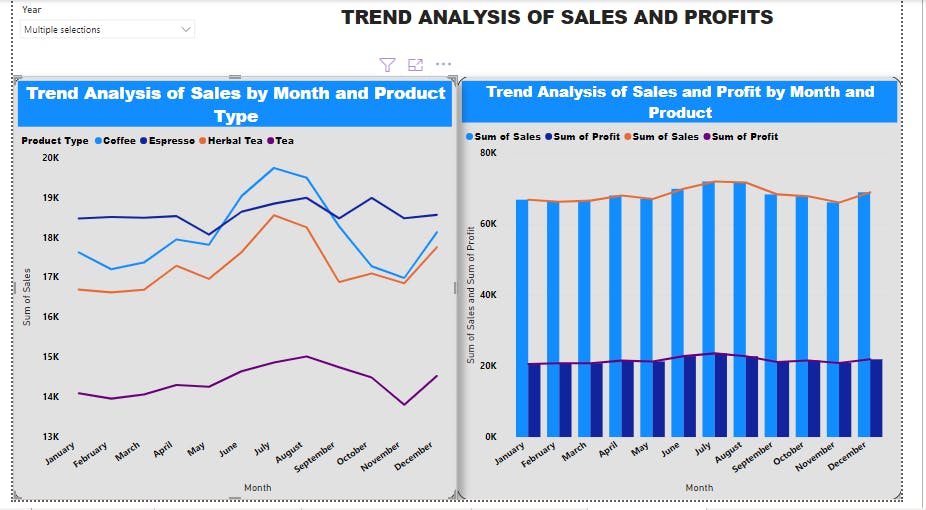
Figure 4: Dashboard 4
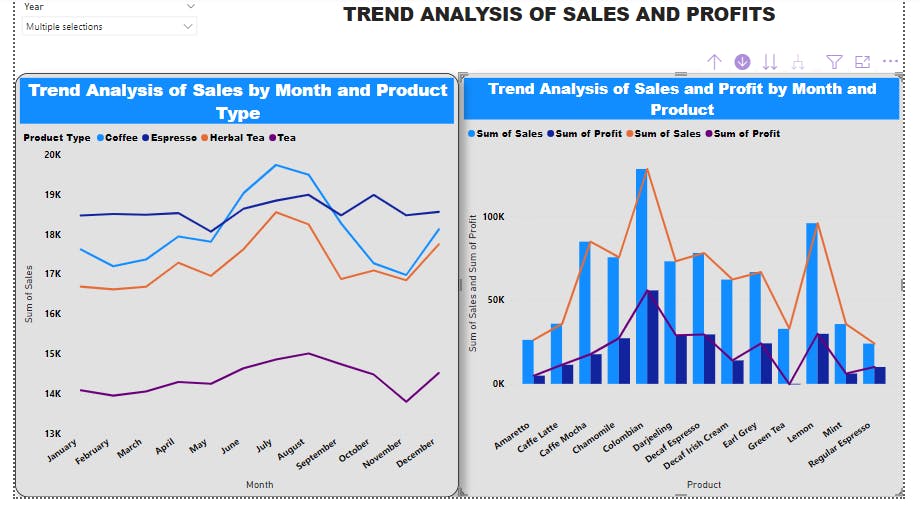
Figure 5: Dashboard 5
Insight Report:
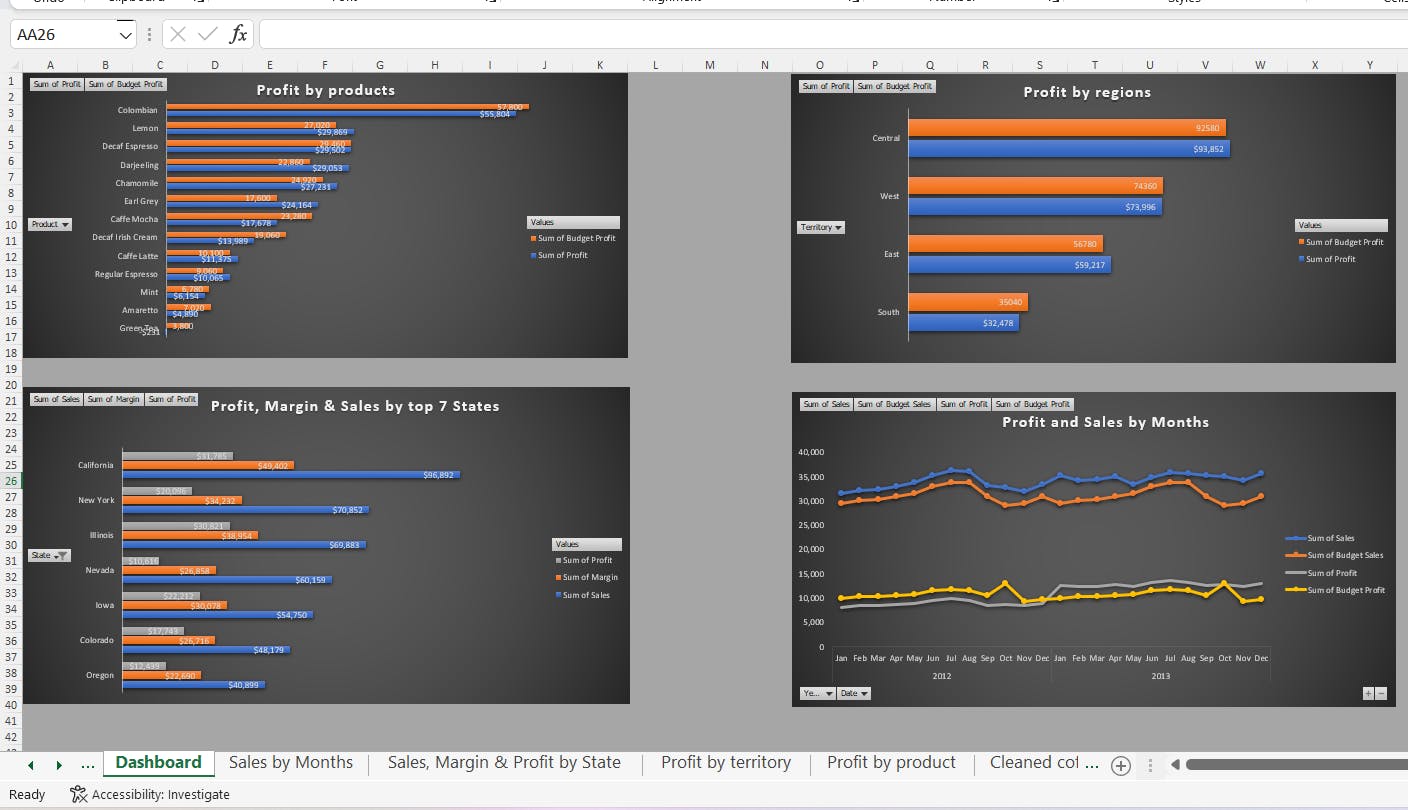
❖ Figure 1, At 272,264, West had the highest Sum of Sales and was 161.98% higher than South, which had the lowest Sum of Sales at 103,926. West had the highest Sum of Sales at 272,264, followed by Central, East, and South. West accounted for 33.21% of the Sum of Sales. Across all 4 territories, the Sum of Sales ranged from 103,926 to 272,264.: At 96,892, California had the highest Sum of Sales and was 550.85% higher than New Hampshire, which had the lowest Sum of Sales at 14,887.California accounted for 11.82% of the Sum of Sales. Across all 20 States, the Sum of Sales ranged from 14,887 to 96,892.
❖ Figure 2, The sum of Profit (45.25% increase) and the Sum of Sales (4.36% increase) both trended up, between 2012 and 2013. At 51240, Colombian had the highest Sum of Budget COGS and was 439.37% higher than Regular Espresso, which had the lowest Sum of Budget COGS at 9,500.The Sum of Budget COGS and the total Sum of COGS are positively correlated. Colombian accounted for 16.12% of the Sum of Budget COGS. The Sum of COGS and the Sum of Budget COGS diverged the most when the Product was Lemon when the Sum of COGS was 8934 higher than the Sum of Budget COGS. Across all 13 Products, the Sum of Budget Profit ranged from 3800 to 57800, and the Sum of Profit ranged from -231 to 55,804.
❖ Figure 3, West had the highest Sum of Sales at 27,2264, followed by Central, East, and South. West accounted for 33.21% of Sum of Sales. California accounted for 11.82% of the Sum of Sales and 12.25% of the profit. Colombian 15.65% of sales and 21.48% of profits. ❖ Figure 4, At 128311, Colombian had the highest Sum of Sales and was 433.94% higher than Regular Espresso, which had the lowest Sum of Sales at 24031.The Sum of Sales and the total Sum of Profit are positively correlated with each other. Colombian accounted for 15.65% of the Sum of Sales. The Sum of Sales and Sum of Profit diverged the most when the Product was Colombian when the Sum of Sales was 72507 higher than the Sum of Profit. The espresso had the highest total Sum of Sales at 222996, followed by Coffee, Herbal Tea, and Tea. July in Product Type made up 2.41% of the Sum of Sales. The espresso had the highest average Sum of Sales at 18,583.00, followed by Coffee, Herbal Tea, and Tea.
❖ Figure 5, At 55804, Colombian had the highest Sum of Profit and was 104.93% higher than Chamomile, which had the lowest Sum of Profit at 27231.Colombian accounted for 32.55% of the Sum of Profit. Across all 5 Products, the Sum of Profit ranged from 27231 to 55804. California has the highest sales and profit contribution.