Airport Operational Performance Analysis In United States Using Power Bi


TEAM TASK Work on Airport Operational performance analysis for Airports (could be outside Nigeria) on safety and security
INTRODUCTION Airport security also known as aviation security includes the techniques and methods used in an attempt to protect passengers, staff, aircraft, and airport property from malicious harm, crime, terrorism and other threats. This report aims to show the rate of airport incidents in United States.
DATA The dataset was extracted from Kaggle, and downloaded into excel, it was extracted from excel and loaded into Power bi, then transformed using Power bi Query. It was clean by removing columns that are not needed. The following reports were derived from our data.
Figure 1
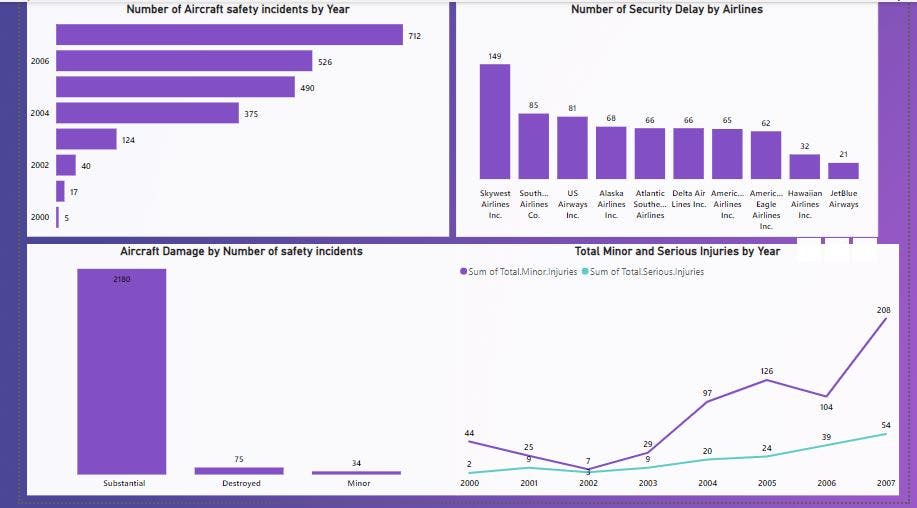
From the above, we have chat showing the number of aircrafts safety incidents by year, from 2000 to 2007, the number of safety incidents increased over the years, whereby the year 2000 had just 5 incidents and 2007 had 712 incidents, another chart showing the number of security delay by airlines, indicating Skywest Airlines with 149 delays as the highest, while JetBlue airways with 21 delays was the lowest, also a trend line showing the total number of minor and serious injury across the years, showing that serious injury was at the lowest in 2000 and at the highest in 2007, while minor injuries also followed the same trend.
Figure 2
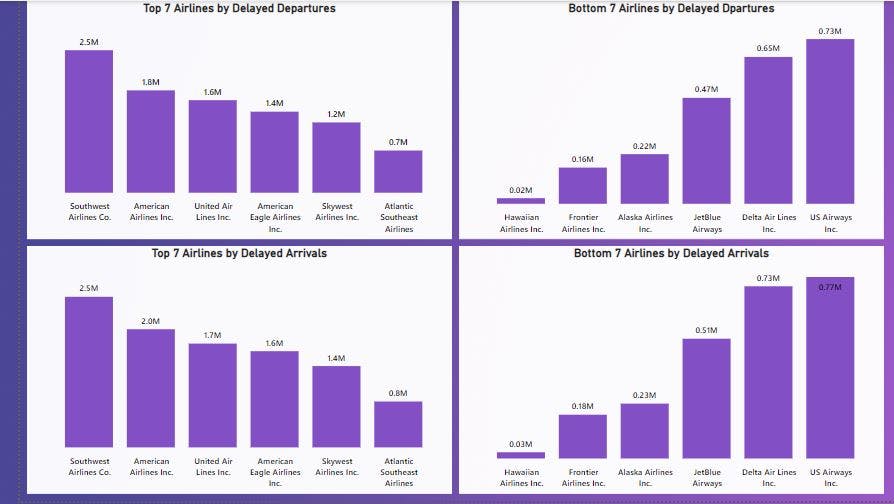
This figure showing the top and bottom 7 airlines for delayed departures and delayed arrivals, Southwest Airlines had the highest delayed departure while Hawaiian Airlines had the lowest delayed departure. This report is also showing that for the delayed arrival, the airlines also followed the same trend.
Figure 3
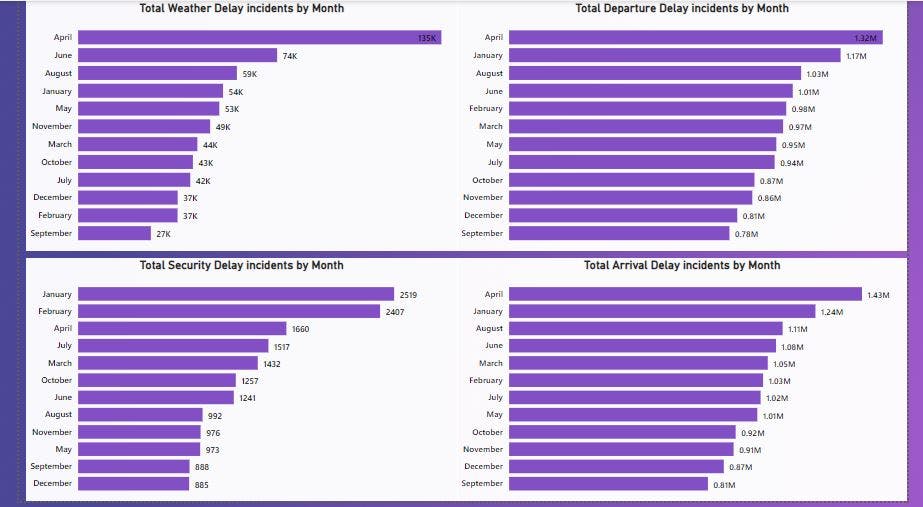
This is showing the total weather delayed incidents by month whereby April recorded the highest occurrence and September the lowest, another chart showing total departure delay incident by month recording April as the highest and September as the lowest, another tile showing security delay incident by month, indicating January with the highest and December with the lowest. The last chart showing total arrival delay incidents by month indicates that September was the lowest and April the highest.